Fred Wilson, who works with Auckland City Council to support their instance of WebEOC has let me have this update on some of the excellent joint planning around response activities that is taking place in the Region. It's really encouraging to see some good operational examples of data exchange and interoperability taking place.
The Auckland CDEM Group, which comprises the Auckland Regional Council and Rodney, North Shore, Waitakere, Auckland City, Manukau, Papakura and Franklin Councils, has completed preparations to provide welfare support in the region should this become necessary.
Using the Auckland City instance of WebEOC, council personnel have been trained to use the system, and supported by the Auckland Region Welfare Advisory Group members (which comprises agencies such as Work & Income, Child Youth and Family, Red Cross, Salvation Army, SPCA, St John, etc.) procedures have been set up to action welfare requests, if this is requested. The current process is that the Northern Region Health Co-ordination Centre (NRHCC) is managing welfare requests associated with consequences of the pandemic in the region, but if the volume becomes unmanageable they may ask for CDEM support.
Preparations include the establishment of a dedicated call centre to take requests for welfare assistance from people referred there from the MoH Healthline. Details will be entered directly into WebEOC, assessed by the Group EOC, and assigned to the various council EOCs as appropriate for action. Where specialist assistance is required, the council will request support from one or more of the welfare agencies. As each request is progressed and action taken, updates entered into WebEOC will be monitored by the Group EOC to detect any areas of over-commitment or delays in responding to requests.
Two short exercises were conducted in early July to test the system and the Auckland CDEM Group region is now ready to provide support if needed.
Using a feature known as Dual Commit, the MoH and Auckland City WebEOC instances can exchange data at the server level. Through this component, the Auckland CDEM personnel can directly access selected non-medical MoH boards such as the National Significant Events and School Closures, and thus easily keep up to date with developments.
Wednesday, July 15, 2009

Monday, June 29, 2009
Facility and Status dashboards
Every Emergency Manager familiar with the capability of EMIS or CIMS systems talks about the need to have 'Dashboards' - display views showing critical information that are often shaded or coloured to highlight particular values based on priority, time due, alert level etc.
Unfortunately as much as everyone thinks they are a good thing (and the answer to all their briefing problems), no-one can really agree on what should actually be in a dashboard. Over the last year or so I've learnt that whilst most database EMIS systems can be built to record and display whatever their administrator or project manager can think of, the real challenge is in identifying data of worth that needs to be displayed.
Some of the NZ Health Emergency Managers may remember a WebEOC board that was used during the WebEOC trial in Ex Cruickshank May 2007. That board was based on the second page of the national health sitrep and allowed a District Health Board to report on bed availability, staff shortages, infrastructure damage, system status and utility failure.
Whilst this was turned into a great looking WebEOC board (a consolidated series of screenshots for 'Shortland St' Hospital is shown below) it underlined the fundamental difficulty in designing effective dashboards - that is how do you usefully record dashboard information such as fire, water damage, power outages or staff shortages for multi-sited, mulit-building, multi-department sites like a modern healthcare facility?
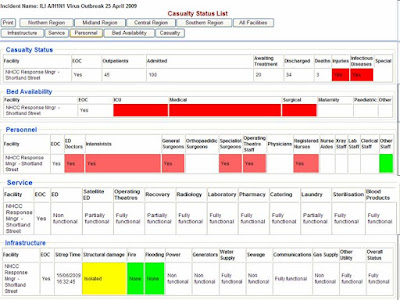
For example the paper based form had the ability to record as 'Functioning' 'Partially Functioning' and 'Not Functioning' for utility and service status that was subdivided into Electricity, Gas, Potable Water, Steam, Sewerage etc. Whilst these three values are easily added to a WebEOC form as a drop down field, and can be shaded in the display view green, orange and red the trouble is it does not really tell you what you need to know.
If Power is 'Partially Functioning' what does that actually mean on a multi-building hospital site, how does the partial power outage impact on the ability to receive casualties? What if it is in the Emergency Department - then there may still be options around field triage or generators but if it is in other departments, such as imaging or ICU the effects may be much greater.
Bed availability is another area that on first glance looks easy but is notoriously difficult to record within a dashboard. Intensive Care Unit capacity is not just the physical bed but also require trained staff, equipment such as ventilators and support systems. Furthermore clinical staff are excellent at actually freeing up capacity when it is required but all of this is dependent on capacity of other departments and wards and is not something that can easily be entered.
Some of the most successful dashboards in this area have been developed in jurisdictions that are linked to business as usual systems, especially Patient Management Systems. For example EM Systems provide a PMS that is used in about a third of US hospitals and is constantly updated on patient location, bed availability and staffing.
In the event of a hospital activating their Emergency Plan this data is immediately available to WebEOC via a special Application Program Interface. The advantages of this are obvious, clinical and clerical staff can get on with responding to the influx of casualties whilst the Emergency Operations Centre will have access to real time data right from the start of the incident.
The design of the NZ Health EMIS is such that it is intended to also support local incidents and not simply to be used in regional or national events. Over the last couple of weeks we've developed a number of APIs for this instance of WebEOC and going forward there is no reason why any NZ Health agency cannot develop APIs between their own business as usual systems and WebEOC.
With the Influenza response ongoing for the forseeable future I'm currently working on some options to host the next EMIS Reference Group meeting and another 'Board Building Boot Camp' to train some additional adminsitrators.
In the event of a hospital activating their Emergency Plan this data is immediately available to WebEOC via a special Application Program Interface. The advantages of this are obvious, clinical and clerical staff can get on with responding to the influx of casualties whilst the Emergency Operations Centre will have access to real time data right from the start of the incident.
The design of the NZ Health EMIS is such that it is intended to also support local incidents and not simply to be used in regional or national events. Over the last couple of weeks we've developed a number of APIs for this instance of WebEOC and going forward there is no reason why any NZ Health agency cannot develop APIs between their own business as usual systems and WebEOC.
With the Influenza response ongoing for the forseeable future I'm currently working on some options to host the next EMIS Reference Group meeting and another 'Board Building Boot Camp' to train some additional adminsitrators.
Dashboard displays and WebEOC adaptability
The ongoing response to Novel Influenza A (H1N1) is continuing to generate a lot of new data reporting and collecting requirements at both local and national level EOCs. The big advantage of WebEOC is that these boards to capture and allow local users to directly enter this data (hence reducing errors from transposing results from fax, email, phonecall) can quickly and easily be developed over a couple of hours and then continually be refined. This ongoing board development can even be done, with a bit of care*, on the production database mid incident.
Last week for example Planning and Intelligence in the NHCC identified the need to start to track several disparate pieces of information around hospital admissions and DHB staff sickness for Influenza Like Illness (ILI) and confirmed cases of H1N1. This information was initially gathered as DHB responses to a Task - Request for Information, and then as regular reporting items within their daily sitrep but it made much more sense to collate it into a table, ideally something that would show the status of all 21 DHBs 'at a glance' and perhaps be expandable to track other key indicators as they are identified. In short, for all the WebEOC administrators out there the elusive lesser spotted WebEOC Dashboard.
The actual board was a pretty basic form, that followed the standard CSS formatting of other display pages within our WebEOC board. The initial build was a little clunky:

The 'Current' and 'Cumulative' data fields were recorded above and below each other, however these data fields were sufficient to get the board 'live' and in use at the end of last week.
Following feedback from the sector the categories were extended to capture cases of ILI as well as confirmed H1N1 and two new views were created, one showing current and the other cumulative data with a 'Viewlink' between them in order to streamline the page.
 The page also has filter views that allow users to view DHBs data within each of the respective Health Regions. As further categories are identified for this 'Dashboard' additional display views will be created, each accessed by a viewlink button of the main display.
There is some further work to still be done; this board currently requires the DHB to manually indicate whether they have Community Based Assessment Centres open. Now ideally that would be a 'Datalink' from the CBAC status board, but unfortunately that is a 'list' and this is a 'form' display. What that means is there is no easy way of getting rolled up data, such as the number of CBACs open, from the CBAC board to this board. To solve this Jeremy has already mentioned his favourite word, Database Trigger, but in the interim I'm afraid users will need to reconfirm this data in two places. If any WebEOC administrator out there has an idea on a solution to this please PM me.
-------------------------------------------------------------------------------------------------
*I'm talking about adding new fields, adding explanatory text, re-labelling fields or re-arranging display views. I'm not talking about adding complicated java script, building SQL database triggers or anything else you wouldn't find in the plain old vanilla WebEOC Admin manual. Even then I still copy and create a back up of the current view or input that I'm about to mess with!
Last week for example Planning and Intelligence in the NHCC identified the need to start to track several disparate pieces of information around hospital admissions and DHB staff sickness for Influenza Like Illness (ILI) and confirmed cases of H1N1. This information was initially gathered as DHB responses to a Task - Request for Information, and then as regular reporting items within their daily sitrep but it made much more sense to collate it into a table, ideally something that would show the status of all 21 DHBs 'at a glance' and perhaps be expandable to track other key indicators as they are identified. In short, for all the WebEOC administrators out there the elusive lesser spotted WebEOC Dashboard.
The actual board was a pretty basic form, that followed the standard CSS formatting of other display pages within our WebEOC board. The initial build was a little clunky:
The 'Current' and 'Cumulative' data fields were recorded above and below each other, however these data fields were sufficient to get the board 'live' and in use at the end of last week.
Following feedback from the sector the categories were extended to capture cases of ILI as well as confirmed H1N1 and two new views were created, one showing current and the other cumulative data with a 'Viewlink' between them in order to streamline the page.
The page also has filter views that allow users to view DHBs data within each of the respective Health Regions. As further categories are identified for this 'Dashboard' additional display views will be created, each accessed by a viewlink button of the main display.There is some further work to still be done; this board currently requires the DHB to manually indicate whether they have Community Based Assessment Centres open. Now ideally that would be a 'Datalink' from the CBAC status board, but unfortunately that is a 'list' and this is a 'form' display. What that means is there is no easy way of getting rolled up data, such as the number of CBACs open, from the CBAC board to this board. To solve this Jeremy has already mentioned his favourite word, Database Trigger, but in the interim I'm afraid users will need to reconfirm this data in two places. If any WebEOC administrator out there has an idea on a solution to this please PM me.
-------------------------------------------------------------------------------------------------
*I'm talking about adding new fields, adding explanatory text, re-labelling fields or re-arranging display views. I'm not talking about adding complicated java script, building SQL database triggers or anything else you wouldn't find in the plain old vanilla WebEOC Admin manual. Even then I still copy and create a back up of the current view or input that I'm about to mess with!
Friday, June 26, 2009
Google maps based Community Based Assessment Centre website
The New Zealand Influenza Pandemic Action Plan allows for the establishment of 'Community Based Assessment Centres', colloquially known by many as "Flu Centres' to assess and treat members of the public with 'Influenza Like Illness' in order to better allocate and manage primary health resources.
The WebEOC CBAC board allows either DHB Emergency Operation Centres or individual CBAC Managers if they are on the internet to record key details of any CBAC established. Whilst a lot of this data is emergency management related there is a field of data that is flagged as public information.


The webpage itself has got some great features including a type ahead address bar and the ability to show which CBACs are actually open and closed based on the time of day and their opening hours that were entered into WebEOC.
The WebEOC CBAC board allows either DHB Emergency Operation Centres or individual CBAC Managers if they are on the internet to record key details of any CBAC established. Whilst a lot of this data is emergency management related there is a field of data that is flagged as public information.
These input displays build into a comprehensive list of Active and Planned CBACs. Those that are active are shown as Green, regardless of their opening times whilst those that have not yet been activated are shown as Red. That allows a DHB such as South Canterbury in the example below to pre-populate planned CBAC locations ahead of time.
The public information is only extracted from the WebEOC Database once a CBAC becomes active. This data, together with its location is overlayed on a public website using the Google Map API.
The webpage itself has got some great features including a type ahead address bar and the ability to show which CBACs are actually open and closed based on the time of day and their opening hours that were entered into WebEOC.
Because it uses a standard Google Map interface it should be familiar to most users and the board also supports a static html page to ensure accessibility for all website users. This website can obviously be linked to from any other agency such as a local DHB or Public Health Unit but can also be used to provide real-time data to other sectors.
The other substantial benefit is that it demonstrates another approach to sharing emergency management data in a GIS mapping format. Whilst the Emergeo GIS plug in we've got is great the user interface on the browser is a little clunky and some of the features such as the ability to turn on and off any GIS layer are beyond what 95% of users need.
The underlying code behind this board could easily be adapted to provide a google maps API based website that shows say Hospital Status reports graphically. I think the advantage of this approach over dedicated GIS Browsers is that the user interface, being google map based, is much more familiar to end users. It also frees up some of the considerable computing resources that would be required to generate a browser environment for hundreds of users.
Just imagine this functionality on a local communities 'Current Civil Defence Emergencies' page but being used to show real time status of Evacuation Reception Centres, road closures or even hazards such as flooding or bush fire.
School Closure Board
Last month it became evident that a number of schools may need to be closed either entirely or selectively (individual classes/year groups) as part of a strategy to manage confirmed cases of Novel H1N1 (Swine Flu). Whilst this obviously has a large community impact on families that need to look after pupils sent home it is an effective public health intervention as part of the cluster control 'Stamp It Out' strategy.
Whilst the closure or partial closure of a school is a local decision within the National Health Coordination Centre we need to have an overview of the number of closures across the country so as to inform the current strategy, the Minister, media and the public.
This is exactly the kind of quantitative emergency management data that WebEOC excels at so with Jeremy busy finalising the public website showing Community Based Assessment Centres (aka Flu Clinics) I rolled my sleeves up and started board building - something I haven't done since lastDecember.
3 hours later, a couple of flat white coffees and a lot of html copying and pasting I'd managed to rip the guts out of the standard ESI Shelters Board and reconfigure it to record school closures.

There are a couple of neat features with this board. Firstly there are two sets of display views; every Planning & Intelligence, Operations and Incident Controller have access to the edit views and can input new schools whilst every other user can view school closures. This allows the range of Civil Defence Emergency Management users and the Ministry of Education to view definitive data that has been entered by the relevant Public Health Unit or District Health Board.
Another neat feature is a filter that works on the re-opening date and allows you filter on 'Current Closures' or 'all historical closures'.
Every address can also be geo-coded. This uses our Emergeo GIS Plug-in and we currently reference the GeoStan address database. At the moment this is just returning the Lat and Long for the school but we are working on the a direct link to the WebEOC server to allow these lat and longs to be used directly to overlay school closures on the current case maps.
We kept this board fairly simple and it works really well. Some neat enhancements would be auto-populating the District Health Board and Public Health Unit name from either the address once it is geocoded or from the username creating the entry. You could also enhance it with a drop down list for the type of school, but I have found with these things you tend to end up missing categories and there are always exceptions out there, especially with a national system.
Whilst we have had a couple of work place closures in response to Novel H1N1 these have not yet been widespread and we have not developed a WebEOC board to track them. I'd be interested to hear from Emergency Managers and WebEOC administrators on what they think the best option would be. It would be easiest to simply build a new board, perhaps by business type to track workplace closures, whilst a more sophisticated option would be to turn this board into a generic closures board an incorporate a list drop down for school, business, public utility etc. That has the advantage of keeping everything in one place but does complicate the board design. Thoughts?
Whilst the closure or partial closure of a school is a local decision within the National Health Coordination Centre we need to have an overview of the number of closures across the country so as to inform the current strategy, the Minister, media and the public.
This is exactly the kind of quantitative emergency management data that WebEOC excels at so with Jeremy busy finalising the public website showing Community Based Assessment Centres (aka Flu Clinics) I rolled my sleeves up and started board building - something I haven't done since lastDecember.
3 hours later, a couple of flat white coffees and a lot of html copying and pasting I'd managed to rip the guts out of the standard ESI Shelters Board and reconfigure it to record school closures.
There are a couple of neat features with this board. Firstly there are two sets of display views; every Planning & Intelligence, Operations and Incident Controller have access to the edit views and can input new schools whilst every other user can view school closures. This allows the range of Civil Defence Emergency Management users and the Ministry of Education to view definitive data that has been entered by the relevant Public Health Unit or District Health Board.
Another neat feature is a filter that works on the re-opening date and allows you filter on 'Current Closures' or 'all historical closures'.
Every address can also be geo-coded. This uses our Emergeo GIS Plug-in and we currently reference the GeoStan address database. At the moment this is just returning the Lat and Long for the school but we are working on the a direct link to the WebEOC server to allow these lat and longs to be used directly to overlay school closures on the current case maps.
We kept this board fairly simple and it works really well. Some neat enhancements would be auto-populating the District Health Board and Public Health Unit name from either the address once it is geocoded or from the username creating the entry. You could also enhance it with a drop down list for the type of school, but I have found with these things you tend to end up missing categories and there are always exceptions out there, especially with a national system.
Whilst we have had a couple of work place closures in response to Novel H1N1 these have not yet been widespread and we have not developed a WebEOC board to track them. I'd be interested to hear from Emergency Managers and WebEOC administrators on what they think the best option would be. It would be easiest to simply build a new board, perhaps by business type to track workplace closures, whilst a more sophisticated option would be to turn this board into a generic closures board an incorporate a list drop down for school, business, public utility etc. That has the advantage of keeping everything in one place but does complicate the board design. Thoughts?
Thursday, June 18, 2009
WebEOC use during Influenza response
With WebEOC having been in use for over 50 days and as many as 180 users online at anytime it is appropriate to provide an update and document some of the many tweaks and enhancements that have been made over the last month.
 The most significant of these was the creation of Board 90. WebEOC Issues and Updates. This board has allowed, Ian, Jeremy and I to address over 200 user suggestions and bugs. Some of these have been as simple as creating new user positions whilst other have addressed additional functionality such as filters or alternative views being created within boards.
Since the start of the incident we have created over 50 additional user log-ons with a range of different levels of access.
These have included a lot of 'View Only' users from other government departments or agencies that will typically only have access to the National Sig Event board and the Influenza Summary Board.
The other group of additional users has tended to be local agencies that are working with DHBs on a day to day basis. This has included both Liaison Officers from local CDEM and a number of Primary Health Organisations. All of these users can be created so that they are in effect co-located within the DHB EOC environment even if not physically located. This 'virtual EOC' has significant benefits in enhancing joint planning and response.
In addition to the Jeremy, the Critchlow developer I normally work with we also had the ebenfit of Ian Downey, who is normally based in Critchlow's Melbourne office joining us for four weeks and he provided additional capacity around some fo the board building and enhancements that were put into place. Ian worked with us during the WebEOC trial in Ex Cruiickshank a couple of years ago and since being based in Asutralia has developed and supported WebEOC installations with a range of federal and state agencies so was able to bring some interesting ideas back with him.
 The most significant of these was the creation of Board 90. WebEOC Issues and Updates. This board has allowed, Ian, Jeremy and I to address over 200 user suggestions and bugs. Some of these have been as simple as creating new user positions whilst other have addressed additional functionality such as filters or alternative views being created within boards.
Since the start of the incident we have created over 50 additional user log-ons with a range of different levels of access.
These have included a lot of 'View Only' users from other government departments or agencies that will typically only have access to the National Sig Event board and the Influenza Summary Board.
The other group of additional users has tended to be local agencies that are working with DHBs on a day to day basis. This has included both Liaison Officers from local CDEM and a number of Primary Health Organisations. All of these users can be created so that they are in effect co-located within the DHB EOC environment even if not physically located. This 'virtual EOC' has significant benefits in enhancing joint planning and response.
In addition to the Jeremy, the Critchlow developer I normally work with we also had the ebenfit of Ian Downey, who is normally based in Critchlow's Melbourne office joining us for four weeks and he provided additional capacity around some fo the board building and enhancements that were put into place. Ian worked with us during the WebEOC trial in Ex Cruiickshank a couple of years ago and since being based in Asutralia has developed and supported WebEOC installations with a range of federal and state agencies so was able to bring some interesting ideas back with him.
 Other major changes have included re-formatting the layout of the Event Log display's at all levels to move away from what some users referred to as the 'rolling toilet paper' display to a more streamlined look as well as the creation of several new boards to track school closures, antiviral stock levels and Community Based Assessment Centres.
Lots of other 'minor' enhancements have also been rolled out. Many of these requiring a bit more work than would initially appear. These incldue the ability to filter tasks by key sections and the development of a more powerful search fucntion for many of the boards.
We've also had the benefit of visits from Fred Wilson who provides WebEOC and Emergency Management consultancy to Auckland City Council and was able to feedback to us on user issues within Auckland as well as a four day visit from the Australian Attorney General's (AG's) Department. AG's were due to attend the WebEOC Users Workshop that had to be postponed last month but took the opportunity to view WebEOC and the National Health Coordination Centre in action.
As the National Health Coordination Centre continues to bed down into an operational response I will endeavour to provide some additional updates on some of the board fetaures that we have added.
Friday, May 1, 2009
Influenza A (H1N1) response
Last Saturday afternoon I got a call from my boss that he was on the way back from the coast and could I meet him at work to discuss a possible national response to passengers that had returned that day from Mexico.
I got in about 20 mins before him and in that time grabbed the first 'ready box' containing a couple of laptops and a couple of phones out of the National Health Coordination Centre (NHCC) 'armoury' and had them and the Smart board up and running in time for when he got in.
Things started a little slowly but rapidly started to escalate as we made contact with Auckland Regional Public Health Service who were undertaking the contact tracing of passengers off the flight that had arrived from Los Angeles that morning.
After a late finish I mountain biked in the next day for a 0930 start and that was the last I saw of my bike until i stuck it on the back of the car on Friday night. By midday we had another 6 positions established within the Ministry's executive board room giving us a Cooridinated Incident Management System (the NZ equivalent to ICS) with a couple of seperate briefing rooms on the side. This room had been identified previously and we fortunate to have 3 ceiling mounted projectors that we used t display EOC and National Sig Events.
Monday brought a welcome surge of additional staff back to Wellington but the fact that NZ is one of the the first countries in the world to wake up every day meant that we had a very high operational tempo from day one responding to developments in Europe and the US that had occured during the night whilst Australia and Asia would start to contact us for updates just as we were hoping things may be slowing down for the day!
Monday afternoon it was decided to relocate the NHCC to a much larger suite of meeting rooms. We had some great support from Information Directorate who established the new NHCC whilst we continued to work upstairs meaning that the last thing we had to do on Monday night was slide the projectors from their ceiling mounts and relocate them and the laptops we had been using down to the second floor. The room we had been working in then became the media briefing room for a series of press conferences including regular joint video media conferences with the Incident Controller in Auckland - a first for NZ I think.
Since the Tuesday the NHCC has been running at a very high intensity in support of operations across the health sector. This has been the first time the sector has operated in Code Yellow, a preparatory state and we are fortunate in having an internationally regarded NZ Influenza Pandemic Action Plan to guide some of our key decisions as well as having reviewed the generic National Health Emergency Plan in th last few months.
The NHCC, like many of the local District Health Board and Public Health Units across the country has been operational for on average 16 hours a day this week, with most staff covering two shifts from 0700-1900 and a number of us covering the hours outside of this as well.
WebEOC has worked extremely well but of course a number of challenges and issues have been raised and will of course be addressed in due course.
I got in about 20 mins before him and in that time grabbed the first 'ready box' containing a couple of laptops and a couple of phones out of the National Health Coordination Centre (NHCC) 'armoury' and had them and the Smart board up and running in time for when he got in.
Things started a little slowly but rapidly started to escalate as we made contact with Auckland Regional Public Health Service who were undertaking the contact tracing of passengers off the flight that had arrived from Los Angeles that morning.
After a late finish I mountain biked in the next day for a 0930 start and that was the last I saw of my bike until i stuck it on the back of the car on Friday night. By midday we had another 6 positions established within the Ministry's executive board room giving us a Cooridinated Incident Management System (the NZ equivalent to ICS) with a couple of seperate briefing rooms on the side. This room had been identified previously and we fortunate to have 3 ceiling mounted projectors that we used t display EOC and National Sig Events.
Monday brought a welcome surge of additional staff back to Wellington but the fact that NZ is one of the the first countries in the world to wake up every day meant that we had a very high operational tempo from day one responding to developments in Europe and the US that had occured during the night whilst Australia and Asia would start to contact us for updates just as we were hoping things may be slowing down for the day!
Monday afternoon it was decided to relocate the NHCC to a much larger suite of meeting rooms. We had some great support from Information Directorate who established the new NHCC whilst we continued to work upstairs meaning that the last thing we had to do on Monday night was slide the projectors from their ceiling mounts and relocate them and the laptops we had been using down to the second floor. The room we had been working in then became the media briefing room for a series of press conferences including regular joint video media conferences with the Incident Controller in Auckland - a first for NZ I think.
Since the Tuesday the NHCC has been running at a very high intensity in support of operations across the health sector. This has been the first time the sector has operated in Code Yellow, a preparatory state and we are fortunate in having an internationally regarded NZ Influenza Pandemic Action Plan to guide some of our key decisions as well as having reviewed the generic National Health Emergency Plan in th last few months.
The NHCC, like many of the local District Health Board and Public Health Units across the country has been operational for on average 16 hours a day this week, with most staff covering two shifts from 0700-1900 and a number of us covering the hours outside of this as well.
WebEOC has worked extremely well but of course a number of challenges and issues have been raised and will of course be addressed in due course.
The National Sig Event board and the Incident Details board have proven to be an extremely effective way of rapidly disseminating key information to the sector in a matter of seconds. The Incident Details board has been adapted to reflect the key information around the response that we wanted to capture and now functions as a one-stop shop for information such as the latest case definitions, border status or national stockpile.
ESI have provided details of a WebFusion server that will allow any jurisdiction around the world to share relevant data on Influenza A (H1N1) and I've got a teleconference with their health users and international customers VP on Monday to discuss the range of data they are trying to pull together.
We have also provided read only or limited access to a large number of government department and a few companies that we have been working closely with and have been supported superbly by Jeremy and Ian who have been working non-stop to address minor tweaks and improvements as well as building a number of new boards to record summary details of case management and other areas.
We still need to work on the business process to better intergrate WebEOC with agencies single point of contact emails. One of the attractions of WebEOC was that it gave the Health Sector a resilient seperate system in the event that any agency looses their corporate email however for events like this in the future we need to ensure we can operate WebEOC alongside business as usual emails without double handling information.
I'll be making contact with some of the multi-national WebEOC corporate users through the ESI forums to review how they intergrate the two systems together.
I also think there is an opportunity to better utilise the database elements of WebEOC by developing interfaces with other systems, whether these are mobilising, patient management systems or epidemiological surveillance. The challenge is to keep WebEOC at the appropriate strategic level, rather than micromanaging the response.
It's too early to say what will happen with Non Seasonal Influenza A but I'm hopeful the EMIS reference group meeting and training will still go ahead towards the end of May. This ongoing incident has certainly provided a robust test of the system.
I'd just like to thank everyone I've worked with over the last week, especially the support we've received in our EOC from other agencies and I'll see you again on my next shift. By then the National Coordinator will have probably worked out that I can still work on WebEOC from home and will have got Jeremy to suspend my account.
I'd also like to recognise all of the work out in the sector, especially the emergency management staff who will be working hard to bring together a range of diverse staff groups to manage the incident.
If any WebEOC administrators need any support or assistance in your jurisdictions with managing this feel free to drop me a line. I'm grateful to the support of Eric Epley at South Texas Regional Advisory Centre for trauma and Phil at WA Police, both WebEOC innovators over the last 4 years, whom I was able to bounce some ideas off over the last few days.


Subscribe to:
Posts (Atom)

 Posts
Posts


