Thursday, September 10, 2009
Managing the welfare aspects of a Pandemic
Auckland CDEM Group have got a great new look website and linked to it is a bi-monthly e-newsletters. The latest edition includes a section linked above outlining some of the Civil Defence activity that has taken place across the region including the rapid roll-out and training of additional Log-on for the Auckland City Council WebEOC in order to enable coordinated management of welfare requests across the region.
Thursday, August 27, 2009
Board Building Boot Camp - August 2009
Following the previous two days of WebEOC meetings it was a relief to have a group of fresh faced programmers and emergency managers from around the country attend for 2 days of administrators training and board building.
This was the first camp that we opened up to other agencies and it was great to see NZ Maritime also attend, as well as Fred Wilson from Auckland City Council who supplied his considerable expertise and experience to support us on the training.
This camp reflected the format of the previous training held last November and worked extremely effectively despite a wide range of programming ability. By the end of the two days everyone had completed a range of boards, including a very effective staff rostering board, a quarantine and incoming flight management board, and administrative changes to Maritime NZ boards.
It's clear there are some extremely competent board developers out there - the challenge now is to develop some policies around the development environment so that we can start delivering local solutions and levering national boards out of them. We also had two developers attend from the Ministry Information Directorate who have been able to gain an in-depth understanding of how the system works and hopefully in the future be able to support ongoing development.
Sincere thanks to everyone who attended and their enthusiasm over the 2 days. I'd also like to thank the Ministry of Civil Defence & Emergency Management for allowing us to utilise the National Crisis Management Centre over the 4 days of meetings and training (the National Health Coordination Centre is currently utilising the laptops and meeting room we would normally use).

Attendees view the boards that everyone had developed in a final 'show and tell'
Tuesday, August 25, 2009
Users Reference Group Meeting
Following the Australasian users group meeting the next day the Health Sector EMIS Reference Group met to review the use of WebEOC and other systems during the last four months of the pandemic response and identify future developments and enhancements.
One of the key issues that has emerged over the last few months was the importance of data definitions and supporting metadata. Whilst WebEOC was incredibly adaptable and many boards and metrics were created 'on the fly' some of the challenges were around the interpretation of this data and better integration with existing Ministry business intelligence tools is a priority.
The form and function of all of the boards utilised during the response was reviewed as was the supporting training material. One of the most critical boards utilised was the 'WebEOC Issues and Updates' board which generated over 750 user suggestions, bugs and enhancements. This was essential in allowing the Emergency Management Team to work with Critchlow's and ensure continual support to the sector as well as a comprehensive record of changes to the system.
Supporting WebEOC we've made considerable work developing the requirements around a 'Reporting and Analysis Database'. This essentially sits in parallel to WebEOC but allows database reporting from a range of systems; WebEOC, EpiSurv (Epidemiological Surveillance), ad-hoc data sources and base data such as census data to be analysed against each other. Whilst ongoing support from Data Base Administrators is required to fix data links if they change it offers significant enhancements to the Intelligence functions. The next phase of work will look at feeding back reports and spatial data, generated from the database in Business Objects, to WebEOC. The intention is that in the future when you go to update metric data as soon as you save the record you will get real time feedback.
Thanks to all of the sector reps that provided such open feedback and suggestions throughout the day.
Monday, August 24, 2009
Australasian WebEOC Users Group

The Ministry of Health hosted the second meeting of Australian and New Zealand WebEOC users in Wellington which was well attended by representatives from Auckland City Council, Maritime Zealand, Qantas and the Ministry, as well a number of agencies considering whether they require an emergency management system, or who may work with agencies that already have WebEOC.
The focus of this meeting was on best practice, board sharing and a review of process and workflow amongst agencies that have or may be implementing WebEOC in the near future and followed on from an initial meeting held in Canberra last year hosted by the Australian Attorney General's Department that examined interoperability across agencies.
In addition to learning agency capability and WebEOC customisation that had been undertaken, there were opportunities identified to better leverage the WebEOC capability across agencies including the development of an agreed data dictionary and standardised data fields for position logs and sit-reps to facilitate dual-committing data as well as some future multi-agency boards to share information at the border.
Fred Wilson (Auckland City Council) also outlined approaches to board design best practice and a draft document has been posted to the WebEOC Community forum.
The outcomes of this meeting and future developments including the agreed WebEOC field names will be posted to a regional forum on the WebEOC community.
Monday, August 10, 2009
ToolTips / Hover Overs added to Board 47

Board 47, that tracks District health Board and ICU quantitative data, has inevitably been subject to changing definitions over the length of the response. In order to provide greater clarity around what a field is actually showing I've added Hover Overs or Tool Tip definitions that have been agreed by NHCC Operations to the display views. This means I can keep the columns headings short but users can read additional detail if they hover the icon over the column.
Now that I've discovered this easy bit of code title="Your hoverover here" you can expect to see additional explanations appearing all over the place.
Thursday, July 30, 2009
Re-formatting layout of ICU List Display.
The addition of an additional two questions to the ICU board meant that the display view was not correctly printing in PDF and the final column, with the all important comments field was missed off the page. Rather than trying to work a whole lot of magic and make the page re-size and print correctly I went for the easy option and have amalgamated the DHB and ICU columns into one in order to pull the comments column back onto the PDF page view.
Whilst this increases the length of the page slightly it was always going to be challenging to fit 25 ICUs on a normal resolution display but over the next couple of weeks I may try and create an alternative display view sized for data projection which will show all ICUs but may need to omit some details like phone, fax and email.
Whilst this increases the length of the page slightly it was always going to be challenging to fit 25 ICUs on a normal resolution display but over the next couple of weeks I may try and create an alternative display view sized for data projection which will show all ICUs but may need to omit some details like phone, fax and email.
Changes to filtering the Task Status Board
The task status board has been amended to improve the filtering and presentation of tasks to agencies that have a substantial number of tasks.
Now whilst you may not think that the 100 or so tasks that the majority of health agencies have received during the pandemic are to unmanageable for a variety of reasons - not least the Ministry NHCC being the hub of 21 DHBs we currently have 27 pages of in progress or closed tasks.
We've used a bit of code to create a drop down list which runs a series of filters. These filters present only tasks that are due in either 24, 48 or 120 hours (5 days). It also excludes all completed tasks (removing 26 pages of closed tasks and therefore speeding up page load) and just for completeness also shows tasks that have expired or were due in the preceding 48 hours. The remain filters for 'All' and 'All Open Tasks' allows both open and closed tasks outside those timeframes to be viewed.
The "My Tasks' filter button continues to work in conjunction with the drop down filters to show those tasks that your user position has either created or been assigned.
The Search functionality remains the same and allows you to search in effect a hidden field which is populated from the values within the subject, details, requester and name fields. Unfortunately you cannot search on both fields and the unique Task ID number but have raised raised an enhancement request with ESI to allow multiple search fields (it is currently one or the other).
Tuesday, July 28, 2009
Australasian WebEOC Users Group Meeting
Preceding the Health Sector Reference Group a number of Australasian WebEOC users are going to meet on Monday 24 August to discuss issues around interoperability, best practice, training and WebEOC development.
Whilst the current economic climate has made travel difficult for agencies I really hope that some of the Australian agencies will be able to make it, but we should still have confirmed attendance from Maritime NZ, Auckland City Council and Ministry of Health.
One of the key discussion points will be on interoperability and sharing common operating picture. There are a range of ways to achieve this and over the last 3 months Health have added log ons at various levels to nearly 100 agencies in order to better share data around the pandemic response however there are also smarter ways to work with database to database links. With that in mind we'd welcome attendance from other agencies who have an EMIS capability or are looking at acquiring one in order to ensure interoperability between agencies in the future.
EMIS Reference Group meetings
A number of meetings postponed because of the Pandemic response at the end of May have been rescheduled for the end of August in Wellington.
The most important of these meetings is on Tuesday 25 August which will see the Health Sector EMIS Reference group meeting to discuss the effectiveness of WebEOC during the current pandemic and what other operational changes need to be made going forward. The reference group has representatives from District Health Boards, Public Health Units, Ambulance Providers and Comms Centre and a number of other specialist providers.
An email went out to the wider health emergency management community with a copy of the agenda and their local representatives but if anyone has not received this please feel free to email me webeoc@moh.govt.nz
Monday, July 20, 2009
Intensive Care Unit direct dashboard reporting via WebEOC
Over the last week ICU clinical directors and their staff from around the country have been getting used to providing direct local figures for their facility into the DHB Dashboard.

In this case it is Auckland DHB which has a Paediatric ICU (Starship) as well as Cardio Vascular and Department of Critical Care Medicine ICUs. These three ICUs all provide summed figures to the main DHB board.
 It has also been an opportunity to start using some of the built-in reporter functionality of the system, and for the non WebEOC Admins out there this basically allows the admins to build a database query and store it on the control panel as a weblink. Clicking the link will open another window and return the pre-canned report which can then been exported to excel and sliced and diced as required. This is a whole level of functionality we have not really utilised so far but allows historical reports and trends over time to be easily viewed.
For example: Want to see how the incident details board has changed over time? - simply run a report and it will show what time and what user changed any of the specified fields. Of course there are a few limitations, because it is returning raw data fields you need to know what the data fields you are interested in were called and sometimes what was clearly labelled to the developer might not be clear to someone looking at the report later.
The data fields were developed by an ICU Advisory group representing intensivists and ICU nursing staff from around the country as well as the Ministry. Colin McArthur, Clinical Director from Auckland Department of Critical Care Medicine and the Operations Team in the National Health Coordination Centre were instrumental in supporting the development of this board and persuading users that we could do better than trying to manage 25 excel spreadsheets returned daily.
The ICU dashboard was built as an additional table within the existing DHB Dashboard. This allows a DHB to add as many ICU facilities as they have and then edit and update the records for those ICUs. The previous ICU data that the DHB Emergency Operations Centre had been entering around patients with confirmed H1N1 is now automatically populated via a related list function from the ICU data.
For a DHB with more that one ICU the numbers for each respective category are automatically summed and provided as a return for the DHB. As you can see below the ICU details appear as a nested table within the DHB detail display.
In this case it is Auckland DHB which has a Paediatric ICU (Starship) as well as Cardio Vascular and Department of Critical Care Medicine ICUs. These three ICUs all provide summed figures to the main DHB board.
There is also a display view linked off the main the DHB Dashboard that provides a consolidated view of all of the ICU units. This type of functionality is incredibly useful and the print to PDF button allows a snapshot view to be rapidly disseminated and shared.
It has also been an opportunity to start using some of the built-in reporter functionality of the system, and for the non WebEOC Admins out there this basically allows the admins to build a database query and store it on the control panel as a weblink. Clicking the link will open another window and return the pre-canned report which can then been exported to excel and sliced and diced as required. This is a whole level of functionality we have not really utilised so far but allows historical reports and trends over time to be easily viewed.For example: Want to see how the incident details board has changed over time? - simply run a report and it will show what time and what user changed any of the specified fields. Of course there are a few limitations, because it is returning raw data fields you need to know what the data fields you are interested in were called and sometimes what was clearly labelled to the developer might not be clear to someone looking at the report later.
Lates updates and changes
The ongoing development of board 47, the DHB Dasboard, including the development of the Intensive Care Unit as well as more consistent reporting via EpiSurv means that board 10 Case Summary has been removed from suers control panels.
We are currently working on an API that will provide a view only display of high level summary data direct from EpiSurv that can displayed on a WebEOC board.
We are currently working on an API that will provide a view only display of high level summary data direct from EpiSurv that can displayed on a WebEOC board.
Wednesday, July 15, 2009
Auckland CDEM Group ready to support Health Sector with WebEOC
Fred Wilson, who works with Auckland City Council to support their instance of WebEOC has let me have this update on some of the excellent joint planning around response activities that is taking place in the Region. It's really encouraging to see some good operational examples of data exchange and interoperability taking place.
The Auckland CDEM Group, which comprises the Auckland Regional Council and Rodney, North Shore, Waitakere, Auckland City, Manukau, Papakura and Franklin Councils, has completed preparations to provide welfare support in the region should this become necessary.
Using the Auckland City instance of WebEOC, council personnel have been trained to use the system, and supported by the Auckland Region Welfare Advisory Group members (which comprises agencies such as Work & Income, Child Youth and Family, Red Cross, Salvation Army, SPCA, St John, etc.) procedures have been set up to action welfare requests, if this is requested. The current process is that the Northern Region Health Co-ordination Centre (NRHCC) is managing welfare requests associated with consequences of the pandemic in the region, but if the volume becomes unmanageable they may ask for CDEM support.
Preparations include the establishment of a dedicated call centre to take requests for welfare assistance from people referred there from the MoH Healthline. Details will be entered directly into WebEOC, assessed by the Group EOC, and assigned to the various council EOCs as appropriate for action. Where specialist assistance is required, the council will request support from one or more of the welfare agencies. As each request is progressed and action taken, updates entered into WebEOC will be monitored by the Group EOC to detect any areas of over-commitment or delays in responding to requests.
Two short exercises were conducted in early July to test the system and the Auckland CDEM Group region is now ready to provide support if needed.
Using a feature known as Dual Commit, the MoH and Auckland City WebEOC instances can exchange data at the server level. Through this component, the Auckland CDEM personnel can directly access selected non-medical MoH boards such as the National Significant Events and School Closures, and thus easily keep up to date with developments.
Monday, June 29, 2009
Facility and Status dashboards
Every Emergency Manager familiar with the capability of EMIS or CIMS systems talks about the need to have 'Dashboards' - display views showing critical information that are often shaded or coloured to highlight particular values based on priority, time due, alert level etc.
Unfortunately as much as everyone thinks they are a good thing (and the answer to all their briefing problems), no-one can really agree on what should actually be in a dashboard. Over the last year or so I've learnt that whilst most database EMIS systems can be built to record and display whatever their administrator or project manager can think of, the real challenge is in identifying data of worth that needs to be displayed.
Some of the NZ Health Emergency Managers may remember a WebEOC board that was used during the WebEOC trial in Ex Cruickshank May 2007. That board was based on the second page of the national health sitrep and allowed a District Health Board to report on bed availability, staff shortages, infrastructure damage, system status and utility failure.
Whilst this was turned into a great looking WebEOC board (a consolidated series of screenshots for 'Shortland St' Hospital is shown below) it underlined the fundamental difficulty in designing effective dashboards - that is how do you usefully record dashboard information such as fire, water damage, power outages or staff shortages for multi-sited, mulit-building, multi-department sites like a modern healthcare facility?
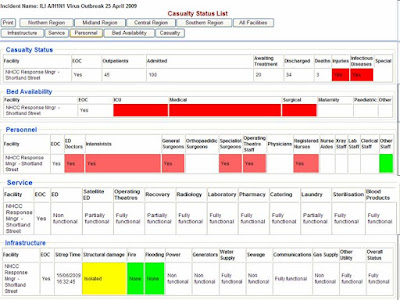
For example the paper based form had the ability to record as 'Functioning' 'Partially Functioning' and 'Not Functioning' for utility and service status that was subdivided into Electricity, Gas, Potable Water, Steam, Sewerage etc. Whilst these three values are easily added to a WebEOC form as a drop down field, and can be shaded in the display view green, orange and red the trouble is it does not really tell you what you need to know.
If Power is 'Partially Functioning' what does that actually mean on a multi-building hospital site, how does the partial power outage impact on the ability to receive casualties? What if it is in the Emergency Department - then there may still be options around field triage or generators but if it is in other departments, such as imaging or ICU the effects may be much greater.
Bed availability is another area that on first glance looks easy but is notoriously difficult to record within a dashboard. Intensive Care Unit capacity is not just the physical bed but also require trained staff, equipment such as ventilators and support systems. Furthermore clinical staff are excellent at actually freeing up capacity when it is required but all of this is dependent on capacity of other departments and wards and is not something that can easily be entered.
Some of the most successful dashboards in this area have been developed in jurisdictions that are linked to business as usual systems, especially Patient Management Systems. For example EM Systems provide a PMS that is used in about a third of US hospitals and is constantly updated on patient location, bed availability and staffing.
In the event of a hospital activating their Emergency Plan this data is immediately available to WebEOC via a special Application Program Interface. The advantages of this are obvious, clinical and clerical staff can get on with responding to the influx of casualties whilst the Emergency Operations Centre will have access to real time data right from the start of the incident.
The design of the NZ Health EMIS is such that it is intended to also support local incidents and not simply to be used in regional or national events. Over the last couple of weeks we've developed a number of APIs for this instance of WebEOC and going forward there is no reason why any NZ Health agency cannot develop APIs between their own business as usual systems and WebEOC.
With the Influenza response ongoing for the forseeable future I'm currently working on some options to host the next EMIS Reference Group meeting and another 'Board Building Boot Camp' to train some additional adminsitrators.
Dashboard displays and WebEOC adaptability
The ongoing response to Novel Influenza A (H1N1) is continuing to generate a lot of new data reporting and collecting requirements at both local and national level EOCs. The big advantage of WebEOC is that these boards to capture and allow local users to directly enter this data (hence reducing errors from transposing results from fax, email, phonecall) can quickly and easily be developed over a couple of hours and then continually be refined. This ongoing board development can even be done, with a bit of care*, on the production database mid incident.
Last week for example Planning and Intelligence in the NHCC identified the need to start to track several disparate pieces of information around hospital admissions and DHB staff sickness for Influenza Like Illness (ILI) and confirmed cases of H1N1. This information was initially gathered as DHB responses to a Task - Request for Information, and then as regular reporting items within their daily sitrep but it made much more sense to collate it into a table, ideally something that would show the status of all 21 DHBs 'at a glance' and perhaps be expandable to track other key indicators as they are identified. In short, for all the WebEOC administrators out there the elusive lesser spotted WebEOC Dashboard.
The actual board was a pretty basic form, that followed the standard CSS formatting of other display pages within our WebEOC board. The initial build was a little clunky:

The 'Current' and 'Cumulative' data fields were recorded above and below each other, however these data fields were sufficient to get the board 'live' and in use at the end of last week.
Following feedback from the sector the categories were extended to capture cases of ILI as well as confirmed H1N1 and two new views were created, one showing current and the other cumulative data with a 'Viewlink' between them in order to streamline the page.
 The page also has filter views that allow users to view DHBs data within each of the respective Health Regions. As further categories are identified for this 'Dashboard' additional display views will be created, each accessed by a viewlink button of the main display.
There is some further work to still be done; this board currently requires the DHB to manually indicate whether they have Community Based Assessment Centres open. Now ideally that would be a 'Datalink' from the CBAC status board, but unfortunately that is a 'list' and this is a 'form' display. What that means is there is no easy way of getting rolled up data, such as the number of CBACs open, from the CBAC board to this board. To solve this Jeremy has already mentioned his favourite word, Database Trigger, but in the interim I'm afraid users will need to reconfirm this data in two places. If any WebEOC administrator out there has an idea on a solution to this please PM me.
-------------------------------------------------------------------------------------------------
*I'm talking about adding new fields, adding explanatory text, re-labelling fields or re-arranging display views. I'm not talking about adding complicated java script, building SQL database triggers or anything else you wouldn't find in the plain old vanilla WebEOC Admin manual. Even then I still copy and create a back up of the current view or input that I'm about to mess with!
Last week for example Planning and Intelligence in the NHCC identified the need to start to track several disparate pieces of information around hospital admissions and DHB staff sickness for Influenza Like Illness (ILI) and confirmed cases of H1N1. This information was initially gathered as DHB responses to a Task - Request for Information, and then as regular reporting items within their daily sitrep but it made much more sense to collate it into a table, ideally something that would show the status of all 21 DHBs 'at a glance' and perhaps be expandable to track other key indicators as they are identified. In short, for all the WebEOC administrators out there the elusive lesser spotted WebEOC Dashboard.
The actual board was a pretty basic form, that followed the standard CSS formatting of other display pages within our WebEOC board. The initial build was a little clunky:
The 'Current' and 'Cumulative' data fields were recorded above and below each other, however these data fields were sufficient to get the board 'live' and in use at the end of last week.
Following feedback from the sector the categories were extended to capture cases of ILI as well as confirmed H1N1 and two new views were created, one showing current and the other cumulative data with a 'Viewlink' between them in order to streamline the page.
The page also has filter views that allow users to view DHBs data within each of the respective Health Regions. As further categories are identified for this 'Dashboard' additional display views will be created, each accessed by a viewlink button of the main display.There is some further work to still be done; this board currently requires the DHB to manually indicate whether they have Community Based Assessment Centres open. Now ideally that would be a 'Datalink' from the CBAC status board, but unfortunately that is a 'list' and this is a 'form' display. What that means is there is no easy way of getting rolled up data, such as the number of CBACs open, from the CBAC board to this board. To solve this Jeremy has already mentioned his favourite word, Database Trigger, but in the interim I'm afraid users will need to reconfirm this data in two places. If any WebEOC administrator out there has an idea on a solution to this please PM me.
-------------------------------------------------------------------------------------------------
*I'm talking about adding new fields, adding explanatory text, re-labelling fields or re-arranging display views. I'm not talking about adding complicated java script, building SQL database triggers or anything else you wouldn't find in the plain old vanilla WebEOC Admin manual. Even then I still copy and create a back up of the current view or input that I'm about to mess with!
Friday, June 26, 2009
Google maps based Community Based Assessment Centre website
The New Zealand Influenza Pandemic Action Plan allows for the establishment of 'Community Based Assessment Centres', colloquially known by many as "Flu Centres' to assess and treat members of the public with 'Influenza Like Illness' in order to better allocate and manage primary health resources.
The WebEOC CBAC board allows either DHB Emergency Operation Centres or individual CBAC Managers if they are on the internet to record key details of any CBAC established. Whilst a lot of this data is emergency management related there is a field of data that is flagged as public information.


The webpage itself has got some great features including a type ahead address bar and the ability to show which CBACs are actually open and closed based on the time of day and their opening hours that were entered into WebEOC.
The WebEOC CBAC board allows either DHB Emergency Operation Centres or individual CBAC Managers if they are on the internet to record key details of any CBAC established. Whilst a lot of this data is emergency management related there is a field of data that is flagged as public information.
These input displays build into a comprehensive list of Active and Planned CBACs. Those that are active are shown as Green, regardless of their opening times whilst those that have not yet been activated are shown as Red. That allows a DHB such as South Canterbury in the example below to pre-populate planned CBAC locations ahead of time.
The public information is only extracted from the WebEOC Database once a CBAC becomes active. This data, together with its location is overlayed on a public website using the Google Map API.
The webpage itself has got some great features including a type ahead address bar and the ability to show which CBACs are actually open and closed based on the time of day and their opening hours that were entered into WebEOC.
Because it uses a standard Google Map interface it should be familiar to most users and the board also supports a static html page to ensure accessibility for all website users. This website can obviously be linked to from any other agency such as a local DHB or Public Health Unit but can also be used to provide real-time data to other sectors.
The other substantial benefit is that it demonstrates another approach to sharing emergency management data in a GIS mapping format. Whilst the Emergeo GIS plug in we've got is great the user interface on the browser is a little clunky and some of the features such as the ability to turn on and off any GIS layer are beyond what 95% of users need.
The underlying code behind this board could easily be adapted to provide a google maps API based website that shows say Hospital Status reports graphically. I think the advantage of this approach over dedicated GIS Browsers is that the user interface, being google map based, is much more familiar to end users. It also frees up some of the considerable computing resources that would be required to generate a browser environment for hundreds of users.
Just imagine this functionality on a local communities 'Current Civil Defence Emergencies' page but being used to show real time status of Evacuation Reception Centres, road closures or even hazards such as flooding or bush fire.
School Closure Board
Last month it became evident that a number of schools may need to be closed either entirely or selectively (individual classes/year groups) as part of a strategy to manage confirmed cases of Novel H1N1 (Swine Flu). Whilst this obviously has a large community impact on families that need to look after pupils sent home it is an effective public health intervention as part of the cluster control 'Stamp It Out' strategy.
Whilst the closure or partial closure of a school is a local decision within the National Health Coordination Centre we need to have an overview of the number of closures across the country so as to inform the current strategy, the Minister, media and the public.
This is exactly the kind of quantitative emergency management data that WebEOC excels at so with Jeremy busy finalising the public website showing Community Based Assessment Centres (aka Flu Clinics) I rolled my sleeves up and started board building - something I haven't done since lastDecember.
3 hours later, a couple of flat white coffees and a lot of html copying and pasting I'd managed to rip the guts out of the standard ESI Shelters Board and reconfigure it to record school closures.

There are a couple of neat features with this board. Firstly there are two sets of display views; every Planning & Intelligence, Operations and Incident Controller have access to the edit views and can input new schools whilst every other user can view school closures. This allows the range of Civil Defence Emergency Management users and the Ministry of Education to view definitive data that has been entered by the relevant Public Health Unit or District Health Board.
Another neat feature is a filter that works on the re-opening date and allows you filter on 'Current Closures' or 'all historical closures'.
Every address can also be geo-coded. This uses our Emergeo GIS Plug-in and we currently reference the GeoStan address database. At the moment this is just returning the Lat and Long for the school but we are working on the a direct link to the WebEOC server to allow these lat and longs to be used directly to overlay school closures on the current case maps.
We kept this board fairly simple and it works really well. Some neat enhancements would be auto-populating the District Health Board and Public Health Unit name from either the address once it is geocoded or from the username creating the entry. You could also enhance it with a drop down list for the type of school, but I have found with these things you tend to end up missing categories and there are always exceptions out there, especially with a national system.
Whilst we have had a couple of work place closures in response to Novel H1N1 these have not yet been widespread and we have not developed a WebEOC board to track them. I'd be interested to hear from Emergency Managers and WebEOC administrators on what they think the best option would be. It would be easiest to simply build a new board, perhaps by business type to track workplace closures, whilst a more sophisticated option would be to turn this board into a generic closures board an incorporate a list drop down for school, business, public utility etc. That has the advantage of keeping everything in one place but does complicate the board design. Thoughts?
Whilst the closure or partial closure of a school is a local decision within the National Health Coordination Centre we need to have an overview of the number of closures across the country so as to inform the current strategy, the Minister, media and the public.
This is exactly the kind of quantitative emergency management data that WebEOC excels at so with Jeremy busy finalising the public website showing Community Based Assessment Centres (aka Flu Clinics) I rolled my sleeves up and started board building - something I haven't done since lastDecember.
3 hours later, a couple of flat white coffees and a lot of html copying and pasting I'd managed to rip the guts out of the standard ESI Shelters Board and reconfigure it to record school closures.
There are a couple of neat features with this board. Firstly there are two sets of display views; every Planning & Intelligence, Operations and Incident Controller have access to the edit views and can input new schools whilst every other user can view school closures. This allows the range of Civil Defence Emergency Management users and the Ministry of Education to view definitive data that has been entered by the relevant Public Health Unit or District Health Board.
Another neat feature is a filter that works on the re-opening date and allows you filter on 'Current Closures' or 'all historical closures'.
Every address can also be geo-coded. This uses our Emergeo GIS Plug-in and we currently reference the GeoStan address database. At the moment this is just returning the Lat and Long for the school but we are working on the a direct link to the WebEOC server to allow these lat and longs to be used directly to overlay school closures on the current case maps.
We kept this board fairly simple and it works really well. Some neat enhancements would be auto-populating the District Health Board and Public Health Unit name from either the address once it is geocoded or from the username creating the entry. You could also enhance it with a drop down list for the type of school, but I have found with these things you tend to end up missing categories and there are always exceptions out there, especially with a national system.
Whilst we have had a couple of work place closures in response to Novel H1N1 these have not yet been widespread and we have not developed a WebEOC board to track them. I'd be interested to hear from Emergency Managers and WebEOC administrators on what they think the best option would be. It would be easiest to simply build a new board, perhaps by business type to track workplace closures, whilst a more sophisticated option would be to turn this board into a generic closures board an incorporate a list drop down for school, business, public utility etc. That has the advantage of keeping everything in one place but does complicate the board design. Thoughts?
Thursday, June 18, 2009
WebEOC use during Influenza response
With WebEOC having been in use for over 50 days and as many as 180 users online at anytime it is appropriate to provide an update and document some of the many tweaks and enhancements that have been made over the last month.
 The most significant of these was the creation of Board 90. WebEOC Issues and Updates. This board has allowed, Ian, Jeremy and I to address over 200 user suggestions and bugs. Some of these have been as simple as creating new user positions whilst other have addressed additional functionality such as filters or alternative views being created within boards.
Since the start of the incident we have created over 50 additional user log-ons with a range of different levels of access.
These have included a lot of 'View Only' users from other government departments or agencies that will typically only have access to the National Sig Event board and the Influenza Summary Board.
The other group of additional users has tended to be local agencies that are working with DHBs on a day to day basis. This has included both Liaison Officers from local CDEM and a number of Primary Health Organisations. All of these users can be created so that they are in effect co-located within the DHB EOC environment even if not physically located. This 'virtual EOC' has significant benefits in enhancing joint planning and response.
In addition to the Jeremy, the Critchlow developer I normally work with we also had the ebenfit of Ian Downey, who is normally based in Critchlow's Melbourne office joining us for four weeks and he provided additional capacity around some fo the board building and enhancements that were put into place. Ian worked with us during the WebEOC trial in Ex Cruiickshank a couple of years ago and since being based in Asutralia has developed and supported WebEOC installations with a range of federal and state agencies so was able to bring some interesting ideas back with him.
 Other major changes have included re-formatting the layout of the Event Log display's at all levels to move away from what some users referred to as the 'rolling toilet paper' display to a more streamlined look as well as the creation of several new boards to track school closures, antiviral stock levels and Community Based Assessment Centres.
Lots of other 'minor' enhancements have also been rolled out. Many of these requiring a bit more work than would initially appear. These incldue the ability to filter tasks by key sections and the development of a more powerful search fucntion for many of the boards.
We've also had the benefit of visits from Fred Wilson who provides WebEOC and Emergency Management consultancy to Auckland City Council and was able to feedback to us on user issues within Auckland as well as a four day visit from the Australian Attorney General's (AG's) Department. AG's were due to attend the WebEOC Users Workshop that had to be postponed last month but took the opportunity to view WebEOC and the National Health Coordination Centre in action.
As the National Health Coordination Centre continues to bed down into an operational response I will endeavour to provide some additional updates on some of the board fetaures that we have added.
Friday, May 1, 2009
Influenza A (H1N1) response
Last Saturday afternoon I got a call from my boss that he was on the way back from the coast and could I meet him at work to discuss a possible national response to passengers that had returned that day from Mexico.
I got in about 20 mins before him and in that time grabbed the first 'ready box' containing a couple of laptops and a couple of phones out of the National Health Coordination Centre (NHCC) 'armoury' and had them and the Smart board up and running in time for when he got in.
Things started a little slowly but rapidly started to escalate as we made contact with Auckland Regional Public Health Service who were undertaking the contact tracing of passengers off the flight that had arrived from Los Angeles that morning.
After a late finish I mountain biked in the next day for a 0930 start and that was the last I saw of my bike until i stuck it on the back of the car on Friday night. By midday we had another 6 positions established within the Ministry's executive board room giving us a Cooridinated Incident Management System (the NZ equivalent to ICS) with a couple of seperate briefing rooms on the side. This room had been identified previously and we fortunate to have 3 ceiling mounted projectors that we used t display EOC and National Sig Events.
Monday brought a welcome surge of additional staff back to Wellington but the fact that NZ is one of the the first countries in the world to wake up every day meant that we had a very high operational tempo from day one responding to developments in Europe and the US that had occured during the night whilst Australia and Asia would start to contact us for updates just as we were hoping things may be slowing down for the day!
Monday afternoon it was decided to relocate the NHCC to a much larger suite of meeting rooms. We had some great support from Information Directorate who established the new NHCC whilst we continued to work upstairs meaning that the last thing we had to do on Monday night was slide the projectors from their ceiling mounts and relocate them and the laptops we had been using down to the second floor. The room we had been working in then became the media briefing room for a series of press conferences including regular joint video media conferences with the Incident Controller in Auckland - a first for NZ I think.
Since the Tuesday the NHCC has been running at a very high intensity in support of operations across the health sector. This has been the first time the sector has operated in Code Yellow, a preparatory state and we are fortunate in having an internationally regarded NZ Influenza Pandemic Action Plan to guide some of our key decisions as well as having reviewed the generic National Health Emergency Plan in th last few months.
The NHCC, like many of the local District Health Board and Public Health Units across the country has been operational for on average 16 hours a day this week, with most staff covering two shifts from 0700-1900 and a number of us covering the hours outside of this as well.
WebEOC has worked extremely well but of course a number of challenges and issues have been raised and will of course be addressed in due course.
The National Sig Event board and the Incident Details board have proven to be an extremely effective way of rapidly disseminating key information to the sector in a matter of seconds. The Incident Details board has been adapted to reflect the key information around the response that we wanted to capture and now functions as a one-stop shop for information such as the latest case definitions, border status or national stockpile.
ESI have provided details of a WebFusion server that will allow any jurisdiction around the world to share relevant data on Influenza A (H1N1) and I've got a teleconference with their health users and international customers VP on Monday to discuss the range of data they are trying to pull together.
We have also provided read only or limited access to a large number of government department and a few companies that we have been working closely with and have been supported superbly by Jeremy and Ian who have been working non-stop to address minor tweaks and improvements as well as building a number of new boards to record summary details of case management and other areas.
We still need to work on the business process to better intergrate WebEOC with agencies single point of contact emails. One of the attractions of WebEOC was that it gave the Health Sector a resilient seperate system in the event that any agency looses their corporate email however for events like this in the future we need to ensure we can operate WebEOC alongside business as usual emails without double handling information.
I'll be making contact with some of the multi-national WebEOC corporate users through the ESI forums to review how they intergrate the two systems together.
I also think there is an opportunity to better utilise the database elements of WebEOC by developing interfaces with other systems, whether these are mobilising, patient management systems or epidemiological surveillance. The challenge is to keep WebEOC at the appropriate strategic level, rather than micromanaging the response.
It's too early to say what will happen with Non Seasonal Influenza A but I'm hopeful the EMIS reference group meeting and training will still go ahead towards the end of May. This ongoing incident has certainly provided a robust test of the system.
I'd just like to thank everyone I've worked with over the last week, especially the support we've received in our EOC from other agencies and I'll see you again on my next shift. By then the National Coordinator will have probably worked out that I can still work on WebEOC from home and will have got Jeremy to suspend my account.
I'd also like to recognise all of the work out in the sector, especially the emergency management staff who will be working hard to bring together a range of diverse staff groups to manage the incident.
If any WebEOC administrators need any support or assistance in your jurisdictions with managing this feel free to drop me a line. I'm grateful to the support of Eric Epley at South Texas Regional Advisory Centre for trauma and Phil at WA Police, both WebEOC innovators over the last 4 years, whom I was able to bounce some ideas off over the last few days.


Friday, April 24, 2009
Board Building Boot Camp 27 & 28 May
Following the EMIS reference Group meeting another two day board building boot camp will be held in Wellington for would-be WebEOC administrators.
The first day provides an opportunity for those with no programming experience to be trained in the basic WebEOC administrator support functions, allowing you to create new incidents, modify board permissions or add additional images to Map Tac.
This day runs in parallel to the 2 day board building camp. This is aimed at those in the sector with some experience of software development or coding and an existing knowledge of html. The first half day is spent learning the WebEOC specific html tags and the administrative functions that support board development before being let loose on the training & development server.
The intention is that those attending will have identified with their agency a requirement for a local board and will be able to have completed this board by the end of the two days with a view to moving it into production once it is performing as expected.
This event ran really well last November and this year we have made a number of spaces available to other agencies that use WebEOC, hoping to build a critical mass of grass roots level board developers and knowledge of WebEOC so that agencies can lever off each others efforts even in other sectors.
I'd love to see those who attended the November course back as well as it is a great opportunity to build some boards away from the distraction of the office and with the on-site support of Jeremy and Ian, Australasia's own WebEOC board-wizards.
If anyone is interested in attending please get in contact.
EMIS Reference Group meeting 26 May
The EMIS Reference Group will meet on the 26 May in Wellington for its 6 monthly meeting. The Group is made up of 12 agencies representing between them the four health regions as well as specific DHB, PHUs, Ambulance and Emergency Ambulance Communications Centre area of WebEOC use.
It has been an extremely busy 6 months for EMIS, with St John in particular working with a number of DHBs and EACC to use WebEOC for pre-planned events during the summer and a significant of work going on behind the scenes on the GIS front that Jeremy and I will be presenting to the group.
Issues raised at the reference group will be fed back to the sector through the various representatives at the quarterly regional emergency management meetings.
Thursday, April 16, 2009
Martime NZ Oil Spill Exercise
Over the days of the 6th and 7th of April Maritime NZ held a exercise down in Dunedin to fully test their WebEOC system. Or as it is described in Martime, the IMS (Information/Incident Management System). Luckily i was able to attend and be involved within the incident as part of the IMS support along with Dave Russell from MNZ's IT team. The exercise was based upon a oil spill in the Otago harbour, and how the team was to respond/manage the whole incident from start to finish. The incident started of with a collision between a ship and a tug on passage while exiting the harbour. Resulting in several tonnes of oil spilling into the harbour. The NRT (National Response Team) was quickly dispatched to help Otago Regional Council deal with the spill. The exercise seemed to run very well, with a lot of work, energy and enthusiasim put in from many people from MNZ and Otago Regional Council. WebEOC was tested well within the NCC (National Communication Centre), out in the field from the Port Chalmers Yacht Club and back at the Wellington office from the DAT team, with minimal problems. People were able to add information to the main Log, compile IAP's, Add/Respond to tasks, Compile sitreps, Add Media Releases, Deploy equipment, Assign personnel, Add Vessell details, track oil release vs recovery, track costs and much more. Below are some action short from the NCC and the Field. | |
 The Operations Team conversing very well | |
 Admin and Logistics team hard at work | |
 Wildlife Team | |
 Planning Team | |
 The NOSC Team, along with Neil Rowath floating in the background planning the next event within the exercise | |
 The Health and Safety Team. - Thank you to Lynne Irving for providing the photo's | |
 The IMS support team, concentraiting hard! :0) | |
 MNZ staff out in the field preping themselves and the equipment | |
 The MNZ cleanup boat used in the exercise | |
 The Dunedin Harbour everyone was working hard to save! |
Monday, April 6, 2009
Position Logging and Tasking in the running for Board of the Year
The Position Logging and Tasking boards have been submitted by ESI to the WebEOC community as one of five boards in contention for "Board Designer of the Year".
These boards form the core of our system and allow any users log entry to be raised to a significant event, visible to any agency involved in the response to that incident but the really clever feature is the work that Jeremy undertook after Ex Ruaumoko when the feedback was that any agency wanted to be able to send and track a task to any other agency. These tasks can be generated from anybodies log entry and then assigner to any combination of internal and external users. This allows your operations and planning teams to be aware of resource requests sent to other agencies.
Competition is always tough (especially as Jeremy from Critchlow won the 'Redline' award for pushing the WebEOC boundaries two years ago) and there are some great boards in the other entries, so I recommend you go and have a look at what other agencies have been working on.
I'd like to thank all of the agencies that have provided feedback during exercises, incidents, training and consultation that have provided the direction that this board has developed in, but really thank Jeremy for his work and skill in developing such an innovative solution to the tasking problem.
Thursday, April 2, 2009
We can see the GeoNet Server but we can't synchronise the data!

Jeremy and I travelled out to Avalon to catch up with the GeoNet team within GNS to test out their newly configured WFS server.
GeoNet are in a fantastic building that used to be a film studio but seems more like the secret base of a James Bond baddie with some serious computers and data displays on the wall next to racks of climbing gear, electric drills, rock anchors, armoured cabling and satellite dishes - my kind of science! All of that kit is necessary to maintain the network of scientific sensors they have across NZ in some of the harshest alpine terrain under attack from the elements, earthquakes, volcanoes and the ever present Kea (alpine parrot).
The WFS server will in theory serve up a range of data allowing other agencies to point their GIS application at the server and add the data layers into their own system.
Unfortunately whilst we could see the server, and see the data layers available we couldn't get them to synchronise to Emergeo. This photo shows a lot of very clever people trying to work the problem out with little success.
Having emailed the Emergeo Technical Support team in Canada I have a patch to apply to our system as soon as I get a chance and we should be in business.
Other agencies that could benefit from real-time GeoNet data within their GIS system should contact the GeoNet outreach coordinator Sara Tresch.
Tuesday, March 31, 2009
Operationalising GeoNet
David Johnston hosted a meeting today at GNS Science in Avalon attended by representatives of GNS Science, including GeoNet, Massey University, including researchers from the Joint Centre for Disaster Research Kestrel Group and MCDEM.
The meeting focused on two issues - getting the GeoNet product, primarily the isoseismal maps and realtime shake maps into emergency operations centres to support operational decision making as well as exploring a number of research proposals in the pipeline around conducting NZ Based research into effective EOC decision making informed by scientific advice.
This problem was very well illustrated during Ex Ruaumoko, last year which looked at an increase in activity within the Auckland Volcanic Field and a critical decision point around evacuation. The challenge being an inverse relationship between time available and certainty of eruption.
Interoperability and appropriate standards were also discussed with reference to the current MCDEM procurement of an emergency management information system and the need to ensure a common operating picture can be shared across all agencies.
Thanks to David and Sara at GNS for hosting and organising this meeting and hopefully the work this week with GeoNet will establish a real time WFS server feed to Emergeo that other agencies can utilise as well.
Thursday, March 19, 2009
Broadband Global Area Network
 I attended the Wellington launch of NZ coverage for Broadband Global Area Network (BGAN) services. Inmarsat (who own and launched the BGAN network) and Wrights (who provide satellite technology in NZ) provided some presentations followed by a hands on demonstration of the Thrane Explorer units that provide the voice and data access to the inmarsat satellites.
BGAN coverage has been extended to New Zealand following the launch last year of an additional Inmarsat 4 satellite that meant that the orbits of all three satellites could be reconfigured to provide global coverage. BGAN is mature well proven technology that has been available for a number of years in the rest of the world so it's great to finally have a range of options for satellite broadband in NZ.
A whole host of agencies and companies attended the launch including 'business as usual' customers who have remote monitoring data requirements as well as a range of emergency services and civil defence organisations from as far away as Canterbury, as well as some private companies and media.
The base station kit seemed to do what it said on the tin, all of the units are easily portable and have slightly varying data rates but essentially all support VOIP and data.
As this photo shows WebEOC loaded fine on the smallest base station - it would be good to do some more in depth testing especially with the Emergeo GIS Smart Client.
As well as the usual VOIP, data and streaming video capability it seems someone else had already had my bright idea and as an add-on unit you can establish a picocell within an Emergency Operations Centre in order to allow staff to continue to use their mobile phones even if the land-based mobile phone network is inoperable.
A number of agencies have already bought BGAN base stations in anticipation of coverage becoming available so it will be great to see the first domestic agencies deploying a similar capability to that which I saw Hutt Valley Emergency Management have with IPSTAR a couple of months ago.
I think as the importance of resilient data communications is recognised we will see agencies employing a range of options from ISDN, fibre, microwave, digital radio data, BGAN and IPSTAR depending on bandwidth and deployability requirements.
As an 'EOC in a bag' it would be hard to beat a BGAN, ruggedised laptop, mini printer and mini-data projector, unless you had something like this 4*4 complete with a satellite tracking dish on the roof and a wireless network to establish your VOIP, live video streaming and data links. Whilst this may seem far fetched setups like this are an established capability for many agencies overseas and need appropriate consideration.


Tuesday, March 17, 2009
Integration of GeoNet data feeds into Emergeo

Last week Jeremy, Martin and I met with Dr Geoff Clitheroe and Dr Paul Grimwood from GNS to discuss integrating GeoNet feeds directly into the Emergeo GIS Browser.
We initially identified two types of content that would be useful; the isoseismal predictions for an event (these use a model to provide indicative Modified Mercalli Intensity levels emanating outwards from an event) and the near real-time shaking intensity from seismographs.
Whilst this mapping is already available on the GeoNet website having it available as a data layer within the Emergency Management Information System means that local Health users on the Emergeo browser can quickly identify health facilities that are within an affected area, whilst those with the Smart Client Emergeo can perform basic geo-spatial analysis, for example identifying the number of people within an affected area.
The screen shot shows an isoseismal layer that has been imported to Emergeo. Over the next month or so Jeremy and I will be working with GNS to establish a WFS server feed so that these data layers can be viewed in real time (rather than imported as a file). There are a number of practical aspects to work through, such as trigger levels and rules around how events such as aftershocks are incorporated into data layers for an incident but we hope to be able to demonstrate a working feed in time for the FOSS4G conference in September.
Monday, March 16, 2009
South Island establishes regular EMIS 'comms checks'
Graeme McColl, the Ministry of Health Regional Emergency Management Advisor for the South Island has established within his region a regular Friday afternoon slot, where agencies can log onto a dedicated WebEOC training incident and practice logging significant events and allocating tasks to other agencies.
Participation is voluntary and can involve as many or as few staff from participating agencies as available. The current 'incident' involves malicious damage to health infrastructure and will allow a range of tasks and reports to be completed over the next couple of months.
The purpose of the session is similar to a weekly radio or sat-phone check and is intended to familiarise staff with the log on procedure, control panel and the boards and forms available rather than to exercise decision making. Each session will only last an hour or so and can be supported by WebEOC administrators via teleconference if required [apologies for last Friday, I was unavailable having concussed myself during my mountain bike commute to work].
This is an extremely easy training event to set up for other regions and areas, allowing EOC staff to participate from their desks or even work from home and compliments the existing sat-phone and Video Teleconference testing regimes recently established.
Well done to all agencies participating!
Saturday, March 14, 2009
Wellington Vodafone Homegrown
St John Ambulance used WebEOC during the Wellington Vodafone Homegrown music festival to manage critical events during the day. Whilst the waterfront went off to the likes of Elemeno-P, Supergroove, Shapeshifter and Concord Dawn, St John looked after the medical needs of all the party goers and used the significant event logs and incident details board to maintain a common operating picture of the event.
Pre-planned events like this provide an excellent opportunity for agencies to familiarise themselves with the emergency management information system, and I'd be happy to work with any other agencies to make sure they are prepared to use it for upcoming events this summer.
Pre-planned events like this provide an excellent opportunity for agencies to familiarise themselves with the emergency management information system, and I'd be happy to work with any other agencies to make sure they are prepared to use it for upcoming events this summer.
Friday, February 27, 2009
Shared EOC and Sig Event boards for Ambulance

Two new display boards have been created that allow Ambulance users to view EOC Event data from around the country.
This change was requested because Emergency Ambulance Communications Centre (EACC) was monitoring St John Northern Regions response to the Battle of The Streets last weekend but as everything was going to plan there were very few 'National Sig Events' created and National Sig Events are the EOC log entries which external agencies can see. Now whilst it was clearly a good thing that nothing was 'Nationally Significant' it is often beneficial for agencies to see what is happening routinely . I guess this is human nature, but it also serves to re-assure other agencies that everything is under control and that in fact there are not a whole load of log entries that have been recommended as a "national Sig Event' that the controller has not got around to reviewing and releasing.
We have got around this very quickly by creating 2 new boards; 02a. Ambulance Shared EOC Events and 03a. Ambulance Shared Sig Events. This means that all 10 of the Ambulance regions or structures can view these common logs. Obviously if an emergency occurs at a pre-planned event these logs will quickly grow in size, but at that point agencies should start using the controller reviewing function and posting to the 'National Sig Event' board.
It is important to remember that the Username will indicate the organisation (Ambulance Region) that has posted the entry. but depending on feedback I may add an additional field to the display on these boars to clearly show posting Agency.
I know some agencies in the US have used a slightly different approach whereby they give user access to a 'National Sig Event' board that will filter and show both controller reviewed entries and those awaiting controller review but I think this approach will work equally as well.
I know some agencies in the US have used a slightly different approach whereby they give user access to a 'National Sig Event' board that will filter and show both controller reviewed entries and those awaiting controller review but I think this approach will work equally as well.
At the next meeting of the EMIS reference group we'll discuss whether similar shared Event logs would be useful on a geographical basis for example between groups of District Health Boards (DHBs) in a defined area, or DHBs and their Public Health Units.
Sunday, February 22, 2009
Battle of The Streets
On Sunday I managed to get out of the office and work with St John Northern Region who were using WebEOC to manage  the prehospital response to the motorcycle street racing in world famous Paeroa. This annual event comprises 20 races on a 1.8km street circuit, with crowds of up to 10,000 separated from the track by mesh fencing and straw bales.

the prehospital response to the motorcycle street racing in world famous Paeroa. This annual event comprises 20 races on a 1.8km street circuit, with crowds of up to 10,000 separated from the track by mesh fencing and straw bales.The position logging and Sig Events were used to maintain an overview of activity throughout the day, tracking events such as track opening and closures, pace car laps or incidents in the crowd and on the track.
St John were there to provide an enhanced level of pre-hospital care to competitors and the crowd, ensuring that the towns usual ambulance was avilable for routine calls outside the event, as well as a range of first aid type treatments that you would expect in a ;arge public event. The use of the St John Portacom clinic also enable a large number of patients to be treated on scene, greatly reducing the number of patients that need to be transferred to receiving hospitals.
In addition to St John staff logging data in WebEOC I used the Emergeo Smart Client to plot the course overlay, functional sectors and locations of the Incident Command Point, First Aid, Helicopter Landing Site and other features. The great aspect of Emergeo was of course that not only could the health sector view the data in the browser but we were able to export both layers from the incident to other agencies if required or provide them witha kml file so that they could view it in Google Earth.


During the event photos of key track locations were added to Emergeo and this supplemented photos that had been added from google street view and Internet searches the week before - there is an incredible amount of data that can be added around pre-planned events available during the planning stages.
Waikato and the Auckland DHBs, Ambulance Communication Centre, and Ambulance Midland Region also had access to the incident created before hand so that they could provide support in any Mass Casualty Incident.
Waikato and the Auckland DHBs, Ambulance Communication Centre, and Ambulance Midland Region also had access to the incident created before hand so that they could provide support in any Mass Casualty Incident.
The day was a great learning opportunity and increased familiarity around the Emergeo mapping, as well as identifying some refinements to the Incident Action Plan and the need for an Ambulance Event Log, to allow all ambulance regions and comm centre to view a complete event log of entries that have not been raised as sig events.
 WebEOC data was added at the Incident Control Point and in an admin area in the St John office (shown). Some great ideas were tested and there will be a number of refinements to the Incident Action Plan as a result, as well as some guidance on how WebEOC can best be used for other pre-planned events.
 WebEOC data was added at the Incident Control Point and in an admin area in the St John office (shown). Some great ideas were tested and there will be a number of refinements to the Incident Action Plan as a result, as well as some guidance on how WebEOC can best be used for other pre-planned events.
 I'd like to than the District Operations Manager Bruce MacDonald for inviting me up to the event and all of his staff, but especially the event coordinator Hilary Haysom, for looking after me on the day.
Wednesday, February 18, 2009
New Incident Action Plan board
 Last year ESI (The WebEOC developers) released a great set of boards that mirrored the Incident Action Plans within the US National Incident Management System (NIMS). These boards replicated the processes within NIMS ICS forms 202-207 and as a result unfortunately used terminology and description largely unfamiliar to NZ.
In New Zealand we aren't as specific around a national form series and with the exception of a one page IAP template within the Coordinated Incident Management System blue book have no standardised system. Jeremy and I have therefore spent the last couple of months adapting the ESI ICS forms for the New Zealand Health sector. Now the chances are unless you have worked in emergency management in the US or completed some of the on-line NIMS training you are not going to know what an ICS 202 does that an ICS 205 doesn't, so there was quite a lot of work involved in relabelling all of the board links and field descriptions from a number system to a descriptive system. Thus ICS 203 became ' Incident Objectives'. This relabelling was done all the way through the board code as well simply on the displayed pages so that any administrator editing the boards in the future would not encounter a mix of descriptions.
This IAP boards is available under a menu option. Staff can either be given access to the IAP - Input menu or the IAP view only menu. The display view work in exactly the same way as the sitrep board showing either all or the most recent IAPs. Initially Incident Controllers, EOC Managers, Operations and Planning and Intelligence staff will be given access to the input view. The most important thing to remember is that only one user can be editing a draft IAP at a time, this is exactly the same as the process for sitreps.
The completed IAP consists of a number of display views comprising the:
- coversheet - detailing the incident, operational period, time of completion and key roles
- objectives - allowing a number of objectives to be recorded as well as weather forecast and safety messages
- assignment list - allowing you to record your CIMS structure. It also allows additional units and teams to be created within the Operations section and to record resources assigned to them
- communications plan
- medical plan - allowing detailed planning to be undertaken for pre-planned operations Organisation chart.
Each display view can be edited or printed individually allowing you to distribute multiple copies of the communications plan or assignment list. The IAP in its entirity can also be easily and neatly printed to PDF.
As you can imagine having re-labelled and remapped a 1000 odd fields there may be a couple we have missed and we are also having a few teething problems using the board with Master Views. We'll hopefully find and address these issues over the next couple of weeks and will be testing the IAP forms in Ex Paradise (the South Island CDEM exercise) and during the Battle of The Streets in Paeroa this weekend.


Subscribe to:
Posts (Atom)

